General Requirements for Sensors and Transducers
In choosing the right sensor and transducer equipment and in accordance with the system to be censored, it is necessary to pay attention to the following general sensor requirements: (D Sharon, et al, 1982)
linearity
There are many sensors that produce a continuously changing output signal in response to a continuously changing input.
For example, a heat sensor can generate a voltage according to the heat it perceives. In such cases, it is usually possible to know exactly how the output changes compared to the input in the form of a graph.
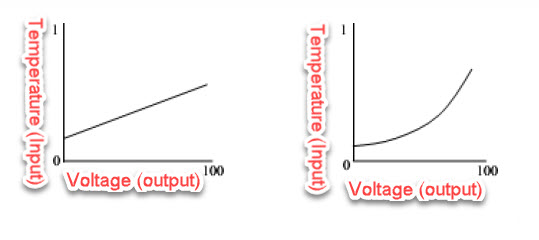
Figure 1 shows the relationship of two different heat sensors. The straight line in figure 1(a). shows a linear response, while in Figure 1(b). is a non-linear response.
 |
| Picture. Output from heat sensors and transducers (D Sharon et al, 1982) |
Sensitivity
Sensitivity will show how far the sensitivity of the sensor to the quantity being measured. Sensitivity is often expressed as a number indicating "change in output versus unit change in input".
Some heat sensors can have a sensitivity expressed as “one volt per degree”, meaning a one-degree change in input will result in a one-volt change in output. Another heat sensor may have a sensitivity of “two volts per degree”, which means it has twice the sensitivity of the first sensor.
Sensor linearity also affects the sensitivity of the sensor. If the response is linear, the sensitivity will also be the same for the entire measurement range. The sensor with the response in Figure 1(b) will be more sensitive at high temperatures than at low temperatures.
Response Time (response time)
The response time on the sensor shows how quickly it responds to changes in input. For example, an instrument with a poor frequency response is a mercury thermometer.
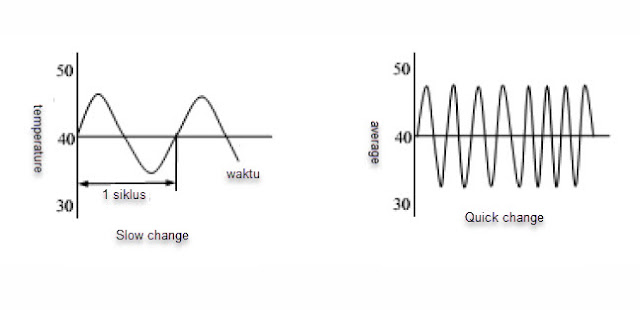
The input is the temperature and the output is the position of the mercury. Suppose the temperature change occurs gradually and continuously with time, as shown in Figure 2(a). Frequency is the number of cycles in one second and is given in hertz (Hz). { 1 hertz means 1 cycle per second, 1 kilohertz means 1000 cycles per second]. At low frequencies, ie when the temperature changes slowly, the thermometer will follow these changes "faithfully".
But if the temperature change is very fast, see Figure 2(b), it is not expected to see a large change in the mercury thermometer, because it is slow and will only show the average temperature.
 |
| Image Temperature changes continuously (D. Sharon, et al, 1982) |
There are various ways to express the frequency response of a sensor. For example “one millivolt at 500 hertz”. Frequency response can also be expressed in "decibels (db)", which is to compare the output power at a certain frequency with the output power at a reference frequency.
